Getting started
At the core of eugene lies a simple outbreak model, which starts with
number of index cases \(n\). The user must also specify
\(\mathcal{R}_0\), \(k\), the generation time between incidences
\(D\), the shape of the Gamma distribution parameterized by parameter
gamma_shape, maximum number of days to simulate days_elapsed_max and
the maximum number of cases beyond which to stop simulating max_cases. We
can specify those parameters in code like so:
import numpy as np
import matplotlib.pyplot as plt

np.random.seed(2020)

parameters = dict(
    R0 = 2,  # reproduction number
    k = 1,   # overdispersion factor
    n = 1,   # number of index cases
    D = 10,  # generation time interval
    gamma_shape = 2,  # gamma function shape parameter
    max_time = 90,    # maximum simulation time
    days_elapsed_max = 52,  # number of days from index case to measurement
    max_cases = 1e4   # maximum number of cases to simulate
)
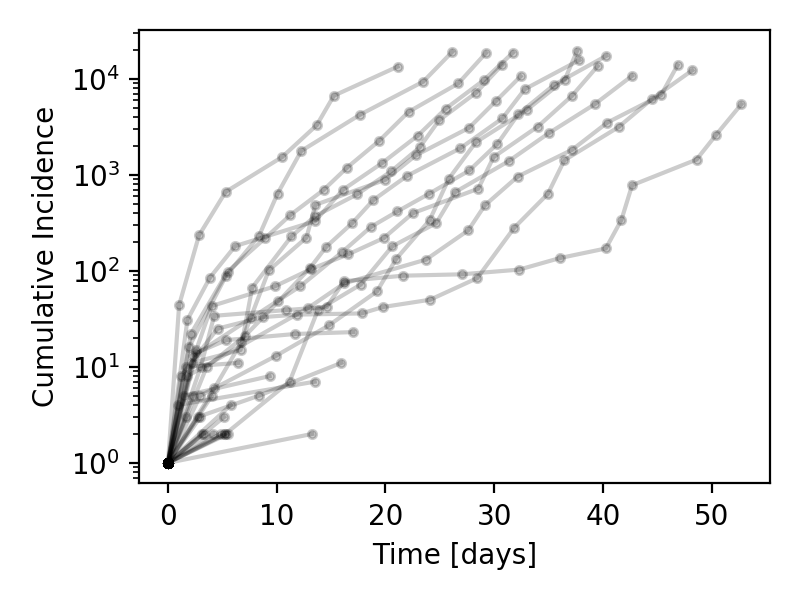
Now we can simulate 100 outbreaks with these initial parameters:
from eugene import simulate_outbreak

fig, ax = plt.subplots(figsize=(4, 3))

for i in range(100):
    times, cumulative_incidence = simulate_outbreak(**parameters)
    ax.semilogy(times, cumulative_incidence, '.-', color='k', alpha=0.2)

ax.set_xlabel('Time [days]')
ax.set_ylabel('Cumulative Incidence')
fig.tight_layout()
plt.show()
(Source code, png, hires.png, pdf)
Every epidemic curve starts at incidence of unity, and the cumulative incidence
grows roughly exponentially, sometimes terminating with zero new cases before
it reaches the end of the simulation domain (set by the days_elapsed_max
parameter).